Research Report / 2026
Flood Resilience · LiDAR · GIS
When Every Foot Matters
Using high-resolution LiDAR and GIS to see flood risk before the water arrives.
A practical report for GIS, public works, engineering, emergency management, planning and resilience leaders in U.S. local government.
Executive Summary
The harder question is no longer whether flooding is possible
For many local governments, the challenge is no longer simply knowing that flooding is possible. The harder question is: where, specifically, will the water go—and what can we do about it before the next storm arrives?
Traditional flood-risk products can answer that question at a regional or watershed scale. But cities and counties increasingly make decisions at a much finer scale: an individual road, intersection, culvert, pump station, neighborhood, public facility or development parcel. That difference in scale matters.
A 2026 study of Dangjin City, South Korea, demonstrates how high-resolution LiDAR combined with relatively standard GIS terrain-analysis techniques can provide a much more detailed view of flood susceptibility without beginning with a complex hydrodynamic model. Researchers created a 1-meter digital elevation model and used five terrain characteristics—elevation, slope, topographic wetness, flow accumulation and distance from streams—to identify where floodwater was most likely to concentrate.
The resulting model was tested against two consecutive extreme rainfall events in 2024 and 2025. The spatial pattern of predicted flood susceptibility became increasingly consistent with observed flooding as rainfall severity increased. Scenario maps representing progressively higher water levels also expanded in a manner that captured more of the locations known to have flooded, eventually capturing all nine confirmed flood locations in the most severe scenario.
For U.S. municipalities, the importance of this research is not that the South Korean model can simply be copied and applied unchanged. It cannot. Terrain type, urbanization, drainage systems and local hydrology affect model performance and require local calibration.
Many communities already possess, or can obtain, enough high-resolution terrain data to create a new layer of flood intelligence between traditional floodplain mapping and full hydraulic engineering studies.
Used appropriately, that intelligence can help local governments identify where detailed engineering should be concentrated, where drainage maintenance may have the greatest impact, which assets deserve closer inspection, where emergency plans should anticipate access problems, and where future development may create unacceptable exposure.
GIS therefore becomes more than the system used to display a flood map. It becomes the environment in which terrain, infrastructure, assets, people and potential consequences can be brought together before an emergency occurs.
Section 1
The Problem Is Resolution
Flooding is inherently local.
Two houses on the same street may experience very different impacts. A few inches of elevation can change the direction of surface runoff. A road embankment can behave like a temporary levee. A depression invisible at conventional mapping scales can become a collection point. A drainage channel, curb, berm or culvert can redirect water into an entirely different part of a neighborhood.
This is one reason coarse elevation models can become problematic when used for highly localized decision-making. Conventional flood-risk approaches frequently rely on elevation models with resolutions of approximately 10 to 30 meters. Those products can be useful for broad planning, but they may be inadequate for parcel-level decisions.
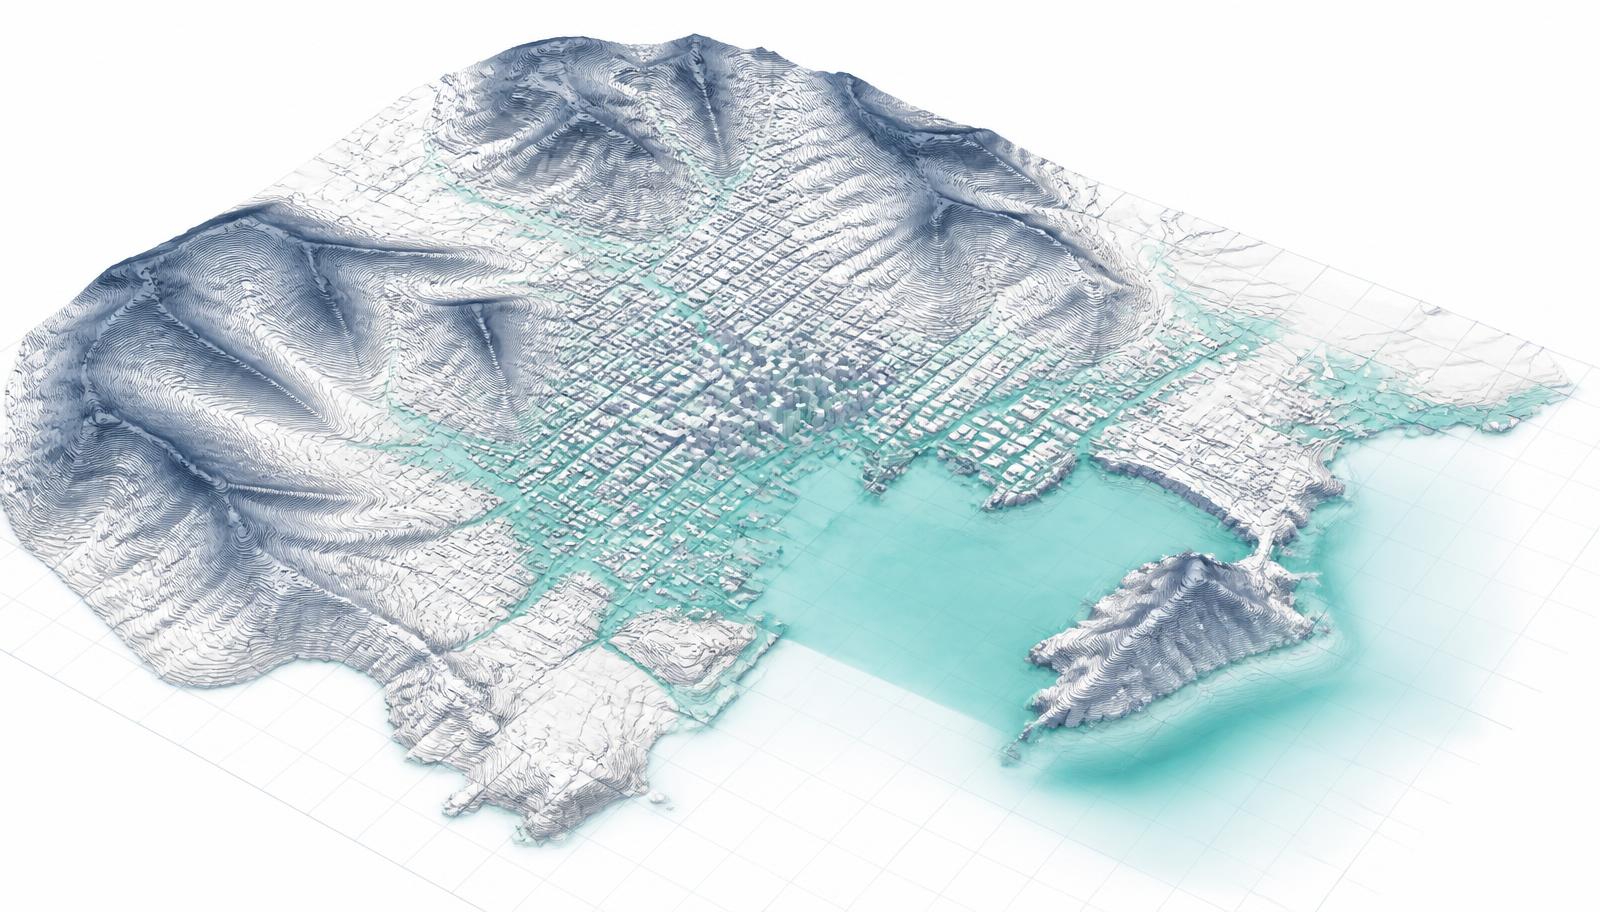
By contrast, LiDAR-derived terrain models can reveal micro-topographic features such as road embankments, drainage channels, shallow depressions and other small elevation changes that influence how water actually moves across developed land.
A regional flood map tells you
Which part of town has a problem?
A high-resolution model helps determine
Which street, asset, drainage path or group of properties is creating or experiencing that problem?
For GIS professionals, that represents a shift in the role of elevation data. LiDAR is no longer simply a basemap or source for contours. It becomes an analytical foundation from which multiple flood-related decision layers can be derived.
- Public works and engineering: see where water naturally wants to travel before considering the engineered drainage system.
- Planning: examine the relationship between topography and future development.
- Emergency management: pre-compute the areas that may become inaccessible or inundated as an event worsens.
- City and county leadership: connect geographically precise risk to capital investment, maintenance and resilience decisions.
Section 2
Turning LiDAR into Flood Intelligence
The approach tested in Dangjin is conceptually straightforward. Researchers began with a one-meter airborne LiDAR-derived digital elevation model.
Importantly, the point cloud was processed to isolate the bare-earth surface from buildings, vegetation, vehicles and other above-ground objects. Quality control was then used to identify remaining errors and confirm the integrity of the terrain model.
From that terrain surface, the researchers derived five factors associated with flood susceptibility.
01
Elevation
Lower areas generally have greater potential for inundation.
02
Slope
Flat and gently sloping areas allow water to accumulate and pond, while steeper terrain generally encourages faster drainage.
03
Topographic Wetness Index
TWI identifies locations where terrain geometry tends to concentrate water.
04
Flow Accumulation
Identifies areas receiving runoff from larger contributing areas upstream.
05
Distance to Stream
Areas closer to drainage channels can face greater exposure to overflow.
The researchers normalized these factors and combined them into a weighted Flood Susceptibility Index. Slope received the largest initial weighting, followed by topographic wetness, elevation, flow accumulation and distance from streams. The resulting continuous surface was then classified using K-means clustering into four categories: low, moderate, high and very high.
That process is important because it turns elevation data into something operational. Instead of asking staff to interpret a DEM, slope raster, wetness map and stream network independently, GIS combines those signals into a common representation of relative susceptibility.
The workflow then goes one step further. Researchers created three simplified inundation scenarios representing water levels 0.5, 1.0 and 2.0 meters above a defined baseline elevation. These were not intended to reproduce all of the physics of an actual flood. Rather, they provided progressively severe planning scenarios showing where inundation could expand as water levels increased.
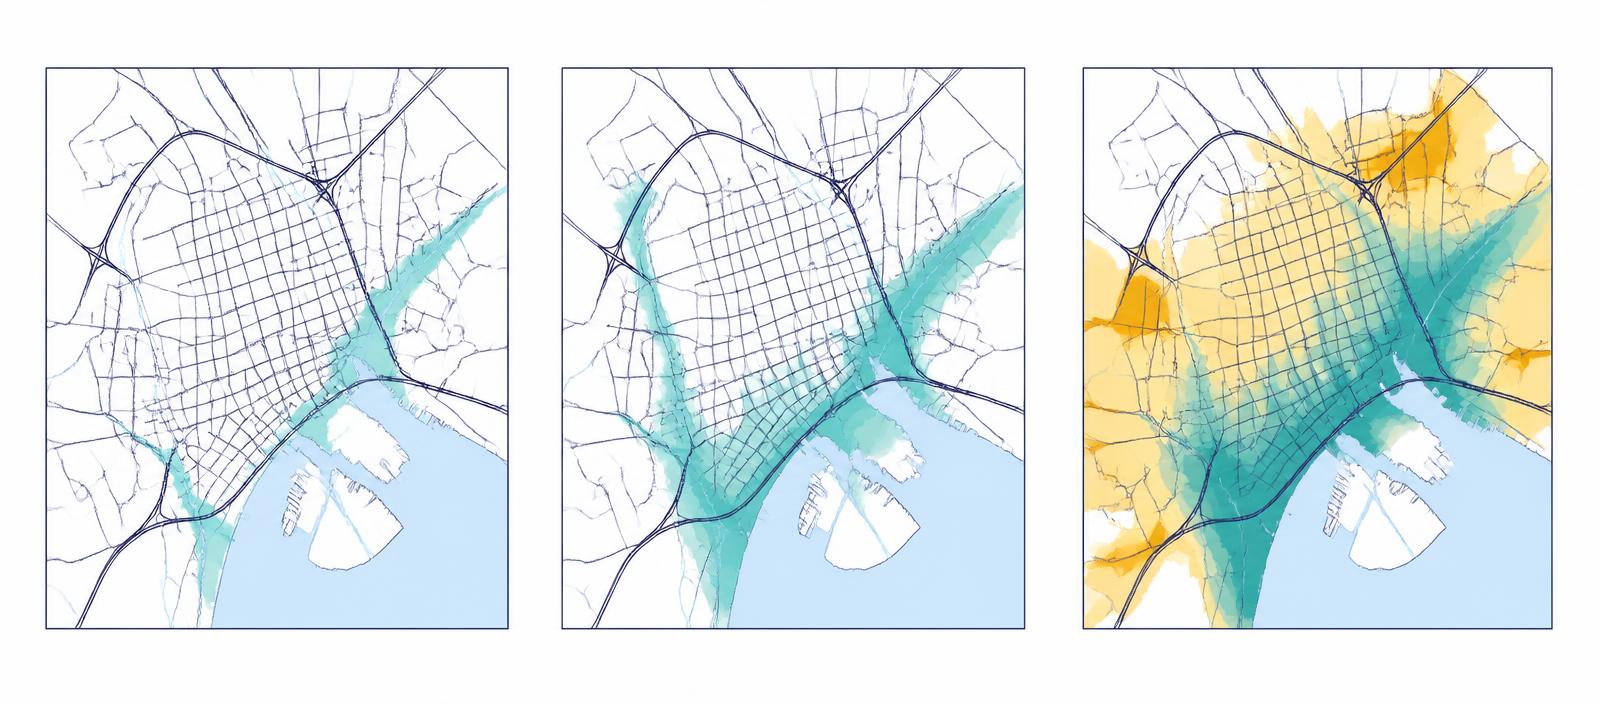
The susceptibility map asks
Where does the terrain make flooding more likely?
The scenario map asks
If water reaches this level, what additional areas could become affected?
Together, the two products begin turning terrain data into a decision-support system.
Section 3
What Happened When the Model Met a Real Flood?
The strongest aspect of the research is that the model was not evaluated only in theory. Dangjin experienced major flooding during two consecutive monsoon seasons. The 2024 event produced 214.6 millimeters of cumulative rainfall in the study dataset, while the 2025 event reached 377.4 millimeters.
The researchers compiled confirmed flood locations using multiple sources, including satellite imagery, field observations and government damage information. As the severity of the inundation scenario increased, the model captured progressively more of those observed flood locations.
| Scenario | 2024 captured | 2025 captured | Modeled area |
|---|---|---|---|
| 0.5 m | 2 of 4 | 2 of 5 | 0.370 km² |
| 1.0 m | 3 of 4 | 4 of 5 | 0.436 km² |
| 2.0 m | 4 of 4 | 5 of 5 | 0.572 km² |
Researchers also tested whether the modeled water was actually connected to the drainage system rather than simply filling isolated low points. Between 91.7% and 93.1% of the predicted inundation area was hydraulically connected to the modeled stream network across the three scenarios.
Sensitivity testing added another level of confidence. After 5,000 Monte Carlo simulations in which the weighting assigned to the five terrain factors was altered, the resulting susceptibility surfaces remained strongly correlated with the original model. The mean Pearson correlation was 0.992.
There is, however, an important qualification. The quantitative spatial validation was far from perfect. The combined Intersection over Union, or IoU, between the modeled high-risk area and observed flood buffers was 6.51%. The value increased from 3.33% for the 2024 event to 6.50% for the more severe 2025 event. The researchers interpret that progression as evidence that the susceptibility model tracked the expansion of flooding as rainfall became more intense.
This is not an argument to replace established engineering and hydraulic modeling. It is an argument for a screening and prioritization layer that helps a community decide where deeper analysis, investment or operational attention is warranted.
Section 4
From Flood Map to Municipal Decision Map
The real opportunity emerges when the flood-susceptibility surface stops being treated as an isolated environmental layer. Imagine placing that surface underneath the operational geography of a city or county. Suddenly, the questions change.
Instead of simply asking where the flood risk is, GIS can begin asking:
- Which roads intersect the highest-susceptibility areas?
- Which bridges, culverts, pump stations or drainage assets are inside them?
- Which water, wastewater or electrical facilities could lose access?
- Which planned capital projects overlap them?
- Which neighborhoods contain vulnerable populations?
- Which evacuation routes cross locations that may become impassable?
- Which parcels proposed for development sit within natural water-accumulation pathways?
- Which maintenance activities could reduce risk before the next storm?
The study identifies three broad areas in which this kind of intelligence can support municipal action: land-use regulation, infrastructure investment and emergency management.
Planning and Development
At a planning level, susceptibility information can become an early-warning layer in development review. A high-susceptibility designation does not automatically mean development should be prohibited. It means the location deserves additional scrutiny.
A planning department could use such information to flag proposed development for further drainage analysis. Engineering could examine finished-floor elevations or access. Public works could evaluate downstream impacts. GIS could identify surrounding infrastructure and previous flood observations.
The important change is timing. Risk becomes visible before the permit, subdivision or capital project is finalized rather than after flooding demonstrates the problem.
Public Works and Capital Planning
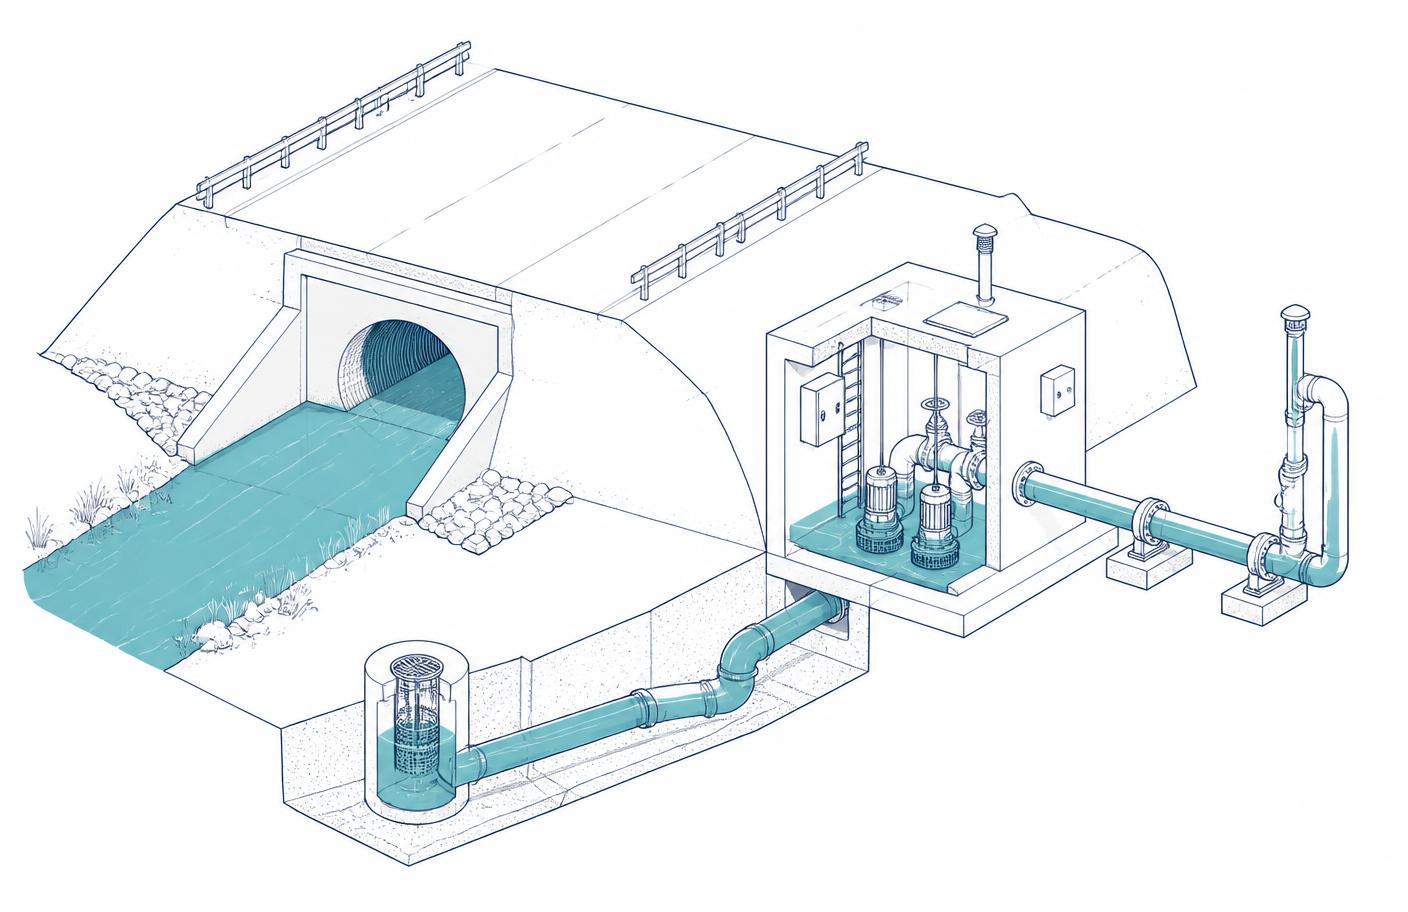
The same model can help shift infrastructure programs from broad maintenance schedules toward geographically prioritized intervention. The Dangjin study discusses measures including culvert improvements, drainage maintenance, channel work, retention and increased pump capacity.
A U.S. jurisdiction could extend that concept by intersecting susceptibility with its own asset-management system. Consider two identical culverts. One lies in terrain with relatively little predicted flood susceptibility. The other lies where high topographic wetness, low elevation and substantial upstream flow accumulation all converge. Those two assets may deserve very different levels of inspection and investment. Add historical work orders, resident complaints, inspection records and asset condition, and the picture becomes even stronger.
Asset condition tells the city
What may fail.
GIS susceptibility tells the city
Where failure may have the greatest flood consequence.
This can help public works departments move from uniform maintenance toward risk-based maintenance. It can also help capital planners compare projects that may otherwise compete for limited funding. The question becomes not simply which culvert is old, but which failing culvert sits in a location where failure could create the greatest consequence. That is a far more useful investment question.
Section 5
Emergency Management Before the First 911 Call
Pre-computed scenarios can also support incident planning before severe weather arrives. In the Dangjin case, progressively larger flood footprints were proposed as potential triggers for escalating levels of response—from early warning through evacuation and maximum-extent planning.
For a U.S. emergency-management organization, the precise thresholds would need to be locally established and validated. But the operating concept is compelling. Instead of constructing the spatial picture after calls begin arriving, a community can establish likely impact zones in advance.
Those zones can then be connected with:
- Emergency shelters
- Critical facilities
- Vulnerable populations
- Road closure plans
- Evacuation routes
- Fire and EMS stations
- Hospitals and police facilities
- Schools
- Water and wastewater assets
- Electrical infrastructure
- Public works equipment
The result is not simply a flood map. It becomes a pre-event operating picture. Emergency managers can begin asking in advance:
- If this corridor becomes inundated, which fire station loses its preferred route?
- If this intersection becomes impassable, what is the alternate evacuation route?
- If water reaches this scenario boundary, which assisted-living facilities require attention?
- If this road closes, can public works still reach the pump station?
- If a neighborhood becomes isolated, where should equipment be staged beforehand?
That is where predictive geography starts becoming operational resilience.
Section 6
GIS Becomes the Integration Layer
There is a larger message here for GIS leaders. Flood resilience is rarely one department's problem.
The terrain may belong to GIS. Drainage assets may belong to public works. Pipes may sit in an asset-management platform. Rainfall observations may come from sensors or weather services. Development information may reside in a permitting system. Historical complaints may be in 311. Emergency facilities may be managed by another department entirely. Capital plans may exist in yet another system.
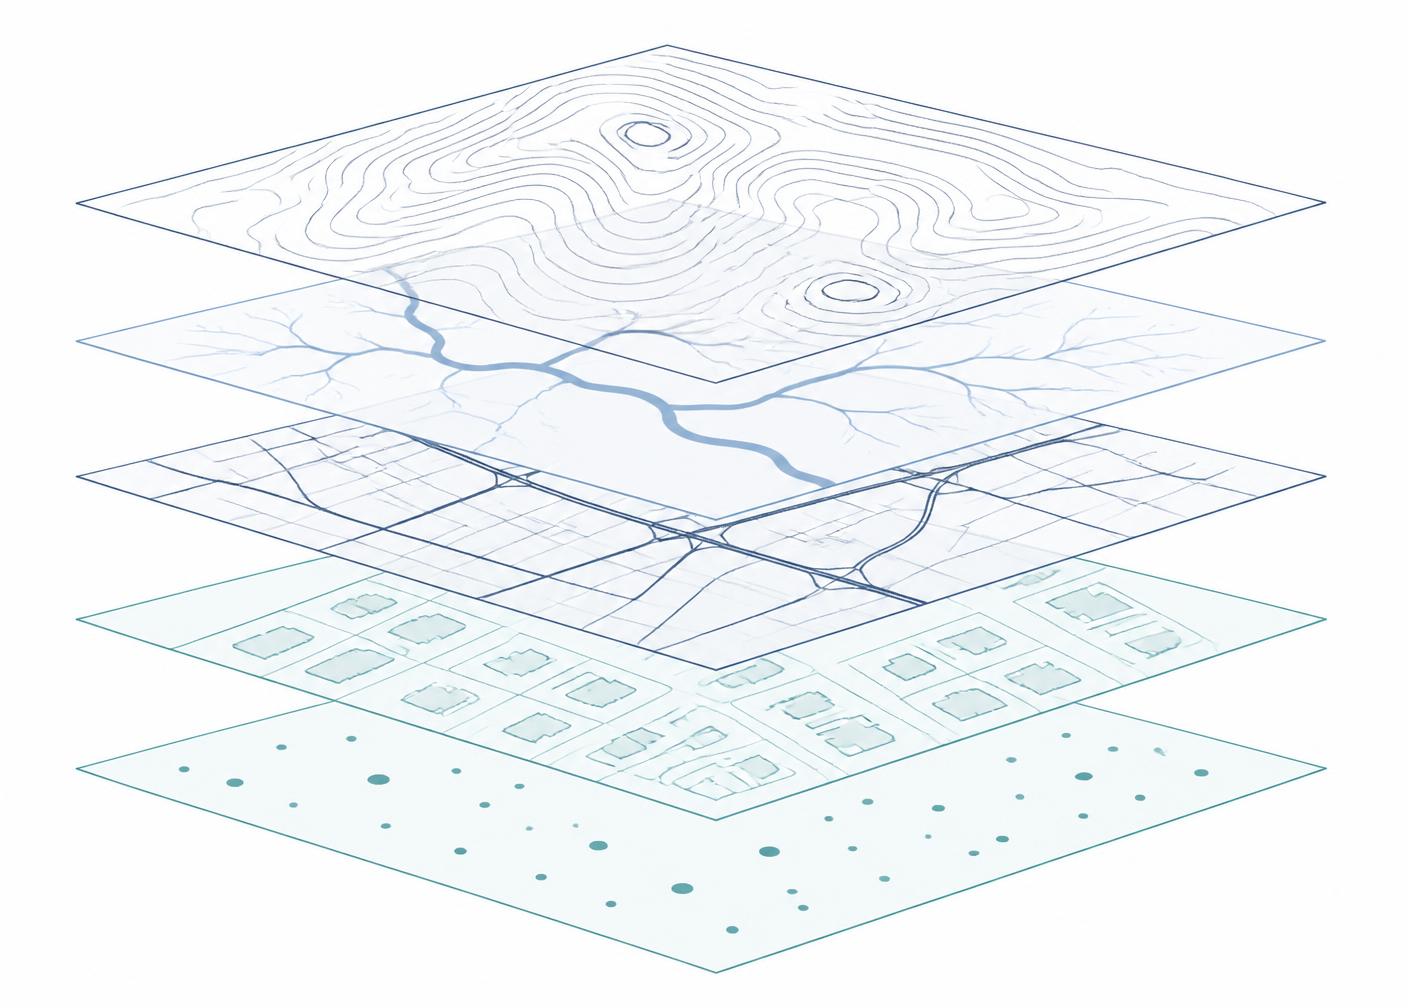
For a local government, this may ultimately be more valuable than the susceptibility algorithm itself. A high-resolution flood model sitting on a GIS analyst's workstation has limited organizational value. The same model connected to roads, buildings, stormwater assets, critical facilities, capital projects and emergency plans can become an enterprise decision layer.
And because the underlying terrain does not change every time it rains, much of that analytical foundation can be developed before an event. That changes the objective from mapping what flooded to understanding what is likely to flood, what is there, and what we can do about it.
Historically, GIS has often helped agencies document what exists and visualize what has already happened. The next step is using spatial relationships to anticipate what might happen. That does not require GIS to become an autonomous decision-maker. Quite the opposite: its value is in giving engineers, planners, emergency managers and public works leaders better evidence with which to make their own decisions.
Section 7
A Practical Starting Point for U.S. Local Government
The research suggests a pragmatic path for communities that are not ready—or do not have the data, budget or need—to construct detailed hydraulic models across every part of their jurisdiction. The first step is not buying another application. It is understanding the elevation data already available.
A community should determine:
- What LiDAR coverage already exists, and how old is it?
- What is its horizontal and vertical accuracy, and what resolution can be derived from it?
- Does the bare-earth model correctly represent drainage channels?
- Are road embankments accurately represented?
- Are levees, berms and similar features visible?
- Are there major gaps in coverage?
From there, GIS can derive terrain characteristics such as slope, flow direction, flow accumulation, wetness and drainage proximity and begin identifying areas where several susceptibility indicators converge.
The next step is validation. Historical flood observations are tremendously valuable. The Dangjin researchers combined remote sensing, field observations and official damage reports rather than relying upon a single source. For a U.S. municipality, useful information might include:
- Past flood polygons
- High-water marks
- Road closure records
- Public works work orders
- Stormwater complaints
- 311 calls
- FEMA or state damage information
- Drone and aerial imagery
- Satellite imagery
- Inspection records
- Emergency-response reports
- Validated resident photographs and observations
The available evidence will differ from one jurisdiction to another. The principle is what matters: compare the predicted geography with what the community knows has actually happened. Only then should the resulting surface be treated as a decision-support layer.
And at that point the most important work begins: intersecting susceptibility with the geography of government itself—assets, infrastructure, residents, development, projects and emergency operations.
Section 8
From Pilot Project to Operational Program
A municipality does not need to model its entire jurisdiction on day one. A more realistic approach is to begin with a clearly defined area where flooding is already a concern.
- A repeatedly flooded neighborhood
- A downtown drainage corridor
- A watershed undergoing rapid development
- An area surrounding a critical facility
- A transportation corridor with recurring closures
- A coastal district
- A location with aging stormwater infrastructure
- A capital-project area where investment is already planned
Start small enough that the findings can be validated. Develop the terrain model. Create the susceptibility layer. Compare it with known flood events. Overlay roads, parcels and infrastructure. Then bring the relevant departments into the room.
GIS may create the map. But public works understands the drainage network, engineering understands structures and capacity, planning understands development pressure, and emergency management understands operational consequences. The greatest value comes from combining those perspectives.
A successful pilot should end not simply with another map but with a short list of decisions:
- Which areas require detailed hydraulic analysis?
- Which drainage assets require inspection?
- Which projects deserve capital consideration?
- Which parcels should trigger additional development review?
- Which emergency routes require alternatives?
- Which locations need additional sensors or monitoring?
- Which datasets are missing?
Those decisions transform a technical GIS exercise into a resilience program.
Section 9
Know What the Model Cannot Tell You
The simplicity of this approach is part of its appeal, but also its biggest limitation. The study's inundation scenarios use a static “bathtub” approach.
- They do not simulate the full dynamic behavior of moving water.
- They do not calculate velocity.
- They do not model the timing of flood propagation.
- They do not fully represent backwater effects.
- They do not simulate changing infiltration.
- They do not dynamically model interactions between rainfall, drainage infrastructure and water levels.
The validation dataset is also small: only nine georeferenced flood locations across two events, and the researchers acknowledge positional uncertainty in some of those observations.
Most importantly for U.S. readers, the weighting of the five terrain factors was developed for a low-gradient coastal plain. Those weights should not simply be transferred to every environment. Mountainous terrain may behave very differently. Highly urbanized environments may require information on impervious surfaces, stormwater capacity, underground pipe networks and inlet locations. Semi-arid regions have their own runoff characteristics. Coastal areas may require tidal and storm-surge information. Communities with substantial levee or flood-control infrastructure may require additional modeling.
For projects requiring engineering-grade predictions of flood depth, velocity, timing or structural performance, more sophisticated two-dimensional hydrodynamic modeling remains appropriate. The original research identifies integration with models such as HEC-RAS 2D as a logical next step.
This should not be positioned as the flood model. It is a high-resolution intelligence layer that helps determine where the municipality should look more closely.
Section 10
The Bigger Opportunity: From Reactive Mapping to Predictive Government
Local government has traditionally been very good at documenting problems after they happen. A pipe breaks. A road floods. A resident calls. A crew responds. A work order is created. An inspection takes place. The asset is repaired. GIS records the location.
But the growing availability of LiDAR, sensors, imagery, asset-management data and increasingly sophisticated analytics creates another possibility. Government can begin asking: where is the next problem most likely to occur?
Flood susceptibility is a good example of that shift. The municipality may already know the terrain. It may already know the drainage assets. It may already know where previous flooding occurred, where complaints are concentrated, and which infrastructure is nearing the end of its useful life.
Individually, those datasets tell useful stories. Together, they can tell a far more powerful one. That is the opportunity for GIS—not simply to map each dataset, but to connect them.
Conclusion: Know Where to Look Before the Storm
The most interesting lesson from the Dangjin research is not a particular algorithm or weighting formula. It is the idea that high-resolution terrain information can move flood planning closer to the scale at which local government actually operates.
A city does not maintain a watershed.
It maintains a particular culvert.
A county does not evacuate a risk category.
It evacuates particular roads and neighborhoods.
A planning department does not approve development at 30-meter resolution.
It approves individual parcels and projects.
A public works director does not allocate an abstract resilience budget.
The department decides which pump station, channel, road or bridge gets attention first.
High-resolution LiDAR makes it possible to see the terrain at that operational scale. GIS makes it possible to connect that terrain to everything government knows about the community.
The Dangjin study demonstrates that a relatively accessible combination of LiDAR-derived elevation data and standard GIS analysis can produce spatially coherent flood-susceptibility information without requiring a fully calibrated hydrodynamic model as the starting point.
For U.S. local governments, that may be the most compelling opportunity. Not another flood map, but a continuously useful geographic intelligence layer that helps planners understand where development deserves more scrutiny, helps public works identify where infrastructure intervention may matter most, helps emergency managers anticipate where access could disappear, and helps leaders direct limited resilience dollars toward the places where geography says they are likely to have the greatest impact.
The objective is not to predict every drop of water. It is to know where to look, what is exposed, and what decisions can be made before the water arrives.
Source and Scope
This report is based on the 2026 research paper:
A High-Resolution LiDAR–GIS Framework for Riverine Flood Risk Prediction and Prevention Under Extreme Rainfall
by Seung-Jun Lee, Tae-Yun Kim, Jisung Kim and Hong-Sik Yun, published in Sustainability. The original research examined a 6.18-square-kilometer study area in Dangjin City, South Korea, using high-resolution LiDAR terrain data and observations from extreme rainfall and flooding during 2024 and 2025.
The U.S. local-government applications discussed in this report are practical interpretations of the research rather than results independently validated in U.S. jurisdictions. Local terrain, hydrology, drainage infrastructure, data quality, engineering requirements and regulatory frameworks should be considered before operational deployment.