Executive White Paper / 2026
Landslide Risk · Earth Observation · AI
Landslide Intelligence: The Evidence Edition
How GIS, Earth observation and AI are changing local-government risk management—and what the peer-reviewed record actually supports.
Audience
GIS directors, public works, engineering, planning, emergency management, city and county executives.
Research basis
2,002 peer-reviewed articles, 2015–2025; 13 primary studies annotated.
Published
2026 · AssetMapping.Events / ConnectMii Events.
Executive Brief
The map is no longer the end product
For decades, landslide susceptibility mapping answered one question: where is terrain most likely to fail? That question still matters. But a 2026 bibliometric review of 2,002 peer-reviewed articles published between 2015 and 2025 documents a decisive shift away from conventional GIS-based susceptibility mapping toward an integrated environment combining GIS, remote sensing, machine learning, Earth observation and cloud computing—what researchers now call Geospatial-AI infrastructure.[1]
Research volume nearly tripled, from 115 articles in 2015 to 318 in 2025, with a sharp inflection after 2019. For local government, that means the tools available have changed fundamentally since most agencies last reviewed their approach to slope risk.
The result is not simply a better landslide map. It is the foundation of a spatial decision system.
Section 01
Why Local Government Should Care
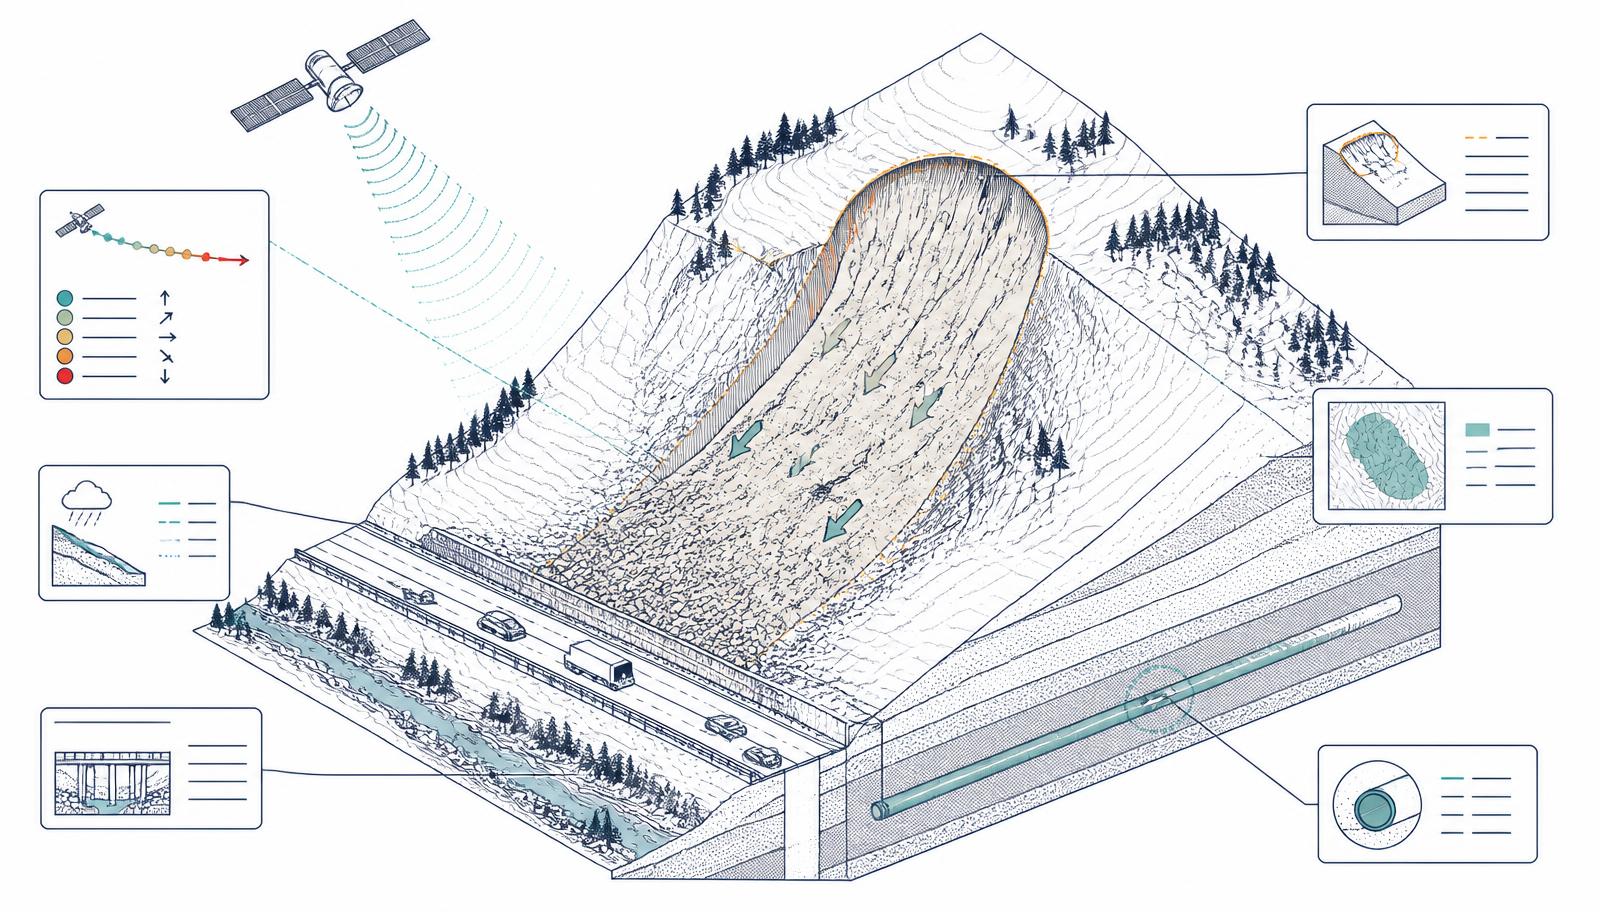
A landslide is rarely just a geological event. When a slope fails, the consequences spread quickly across municipal departments—a road closes, a water main ruptures, a neighborhood loses access, an evacuation route disappears. Susceptibility is shaped by geology, slope angle, rainfall intensity, soil saturation and seismic conditions, compounded by land-use change, deforestation and infrastructure development.[1]
The most useful question may no longer be "Do we have a landslide susceptibility map?" A better question: "Can our organization connect slope risk to infrastructure, development, operations and emergency decisions?"
The cross-departmental nature of landslide risk makes it inherently a GIS problem—not simply an engineering or emergency-management problem. GIS is the common spatial language connecting the physical hazard to the roads, utilities, facilities, parcels and populations that give it operational consequence. Research from 117 countries confirms it: the primary framework advancing the field is not any single algorithm or sensor, but the integration of spatial information across data types and departments.[1]
Section 02
The Technology Shift: From Static Susceptibility to Dynamic Spatial Intelligence
Early susceptibility work combined terrain, geology and historical incidents in GIS to classify an area as high, medium or low. That work remains foundational. Since roughly 2019, a convergence of technologies has made something considerably more dynamic possible.[1]
A 2016 comparative study of support vector machines, random forests and logistic regression for shallow landslide prediction in Vietnam set a widely referenced benchmark.[2] By 2017, multilayer perceptron networks were integrated with GIS at Himalayan scale.[3] By 2021, deep learning was evaluated across Iran's full national inventory using satellite-derived topographic data, with accuracy comparable to or better than earlier statistical methods.[9], [10]
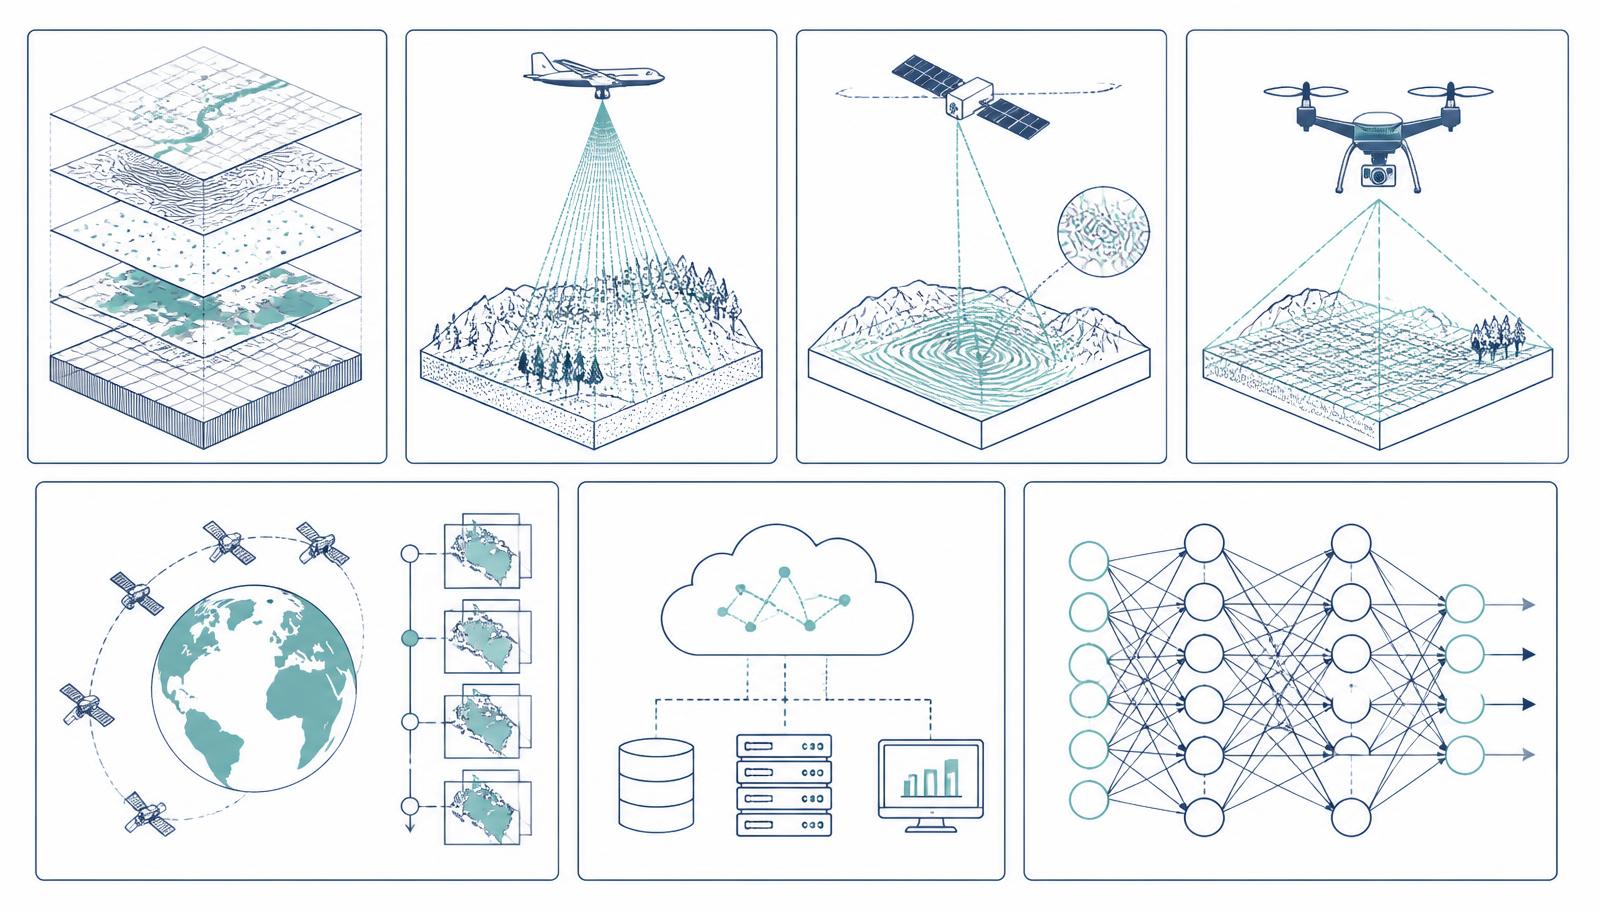
01
GIS
The organizing environment. Combines terrain, geology, parcels, infrastructure, land use and operational data—increasingly where information is interpreted in context, not just displayed.
02
LiDAR
Detailed elevation revealing subtle slope features and drainage. Repeat acquisition enables landscape-change comparison—detecting movement before failure.
03
InSAR
Interferometric radar measures millimeter-scale surface deformation, identifying terrain that may be creeping long before catastrophic failure. [11]
04
UAVs
Drones supply ultra-high-resolution imagery at targeted sites—most valuable for detailed investigation at priority locations identified by other methods. [12]
05
Satellite Earth Observation
Repeat passes bring time-series capability, tracking whether conditions are changing. Sentinel and Landsat data are freely available.
06
Cloud Computing
Platforms such as Google Earth Engine allow analysis of massive Earth-observation datasets without local infrastructure, enabling regional-to-national processing. [1]
07
Artificial Intelligence
Machine learning associates combinations of environmental conditions with previous failures. Random forest, deep learning and ensemble methods dominate recent high-citation research. [7]
Diagram 1 — From Map to Intelligence
- Traditional: terrain + geology + historic incidents → GIS analysis → susceptibility map
- Emerging: terrain + Earth observation + rainfall + land use + infrastructure + history → GIS + cloud + AI → changing risk, exposure and consequence
- Applied: inspection · planning · mitigation · emergency decisions
AI does not replace GIS. It expands what GIS can help government understand.
Section 03
From Hazard to Consequence: A Better Map Is Useful, a Better Decision Is More Valuable
A highly susceptible slope in an isolated area may need monitoring and periodic inspection. A similar slope above a major evacuation route, water-treatment facility or dense neighborhood carries entirely different operational significance.
A multi-hazard suitability study integrating susceptibility with flood risk and development pressure demonstrated that consequence mapping changes which locations agencies should prioritize.[4] More recent quantitative vulnerability modeling extends analysis to individual structures, estimating building damage under extreme rainfall—specificity that supports capital planning, insurance decisions and development review in ways a terrain-based map cannot.[13]
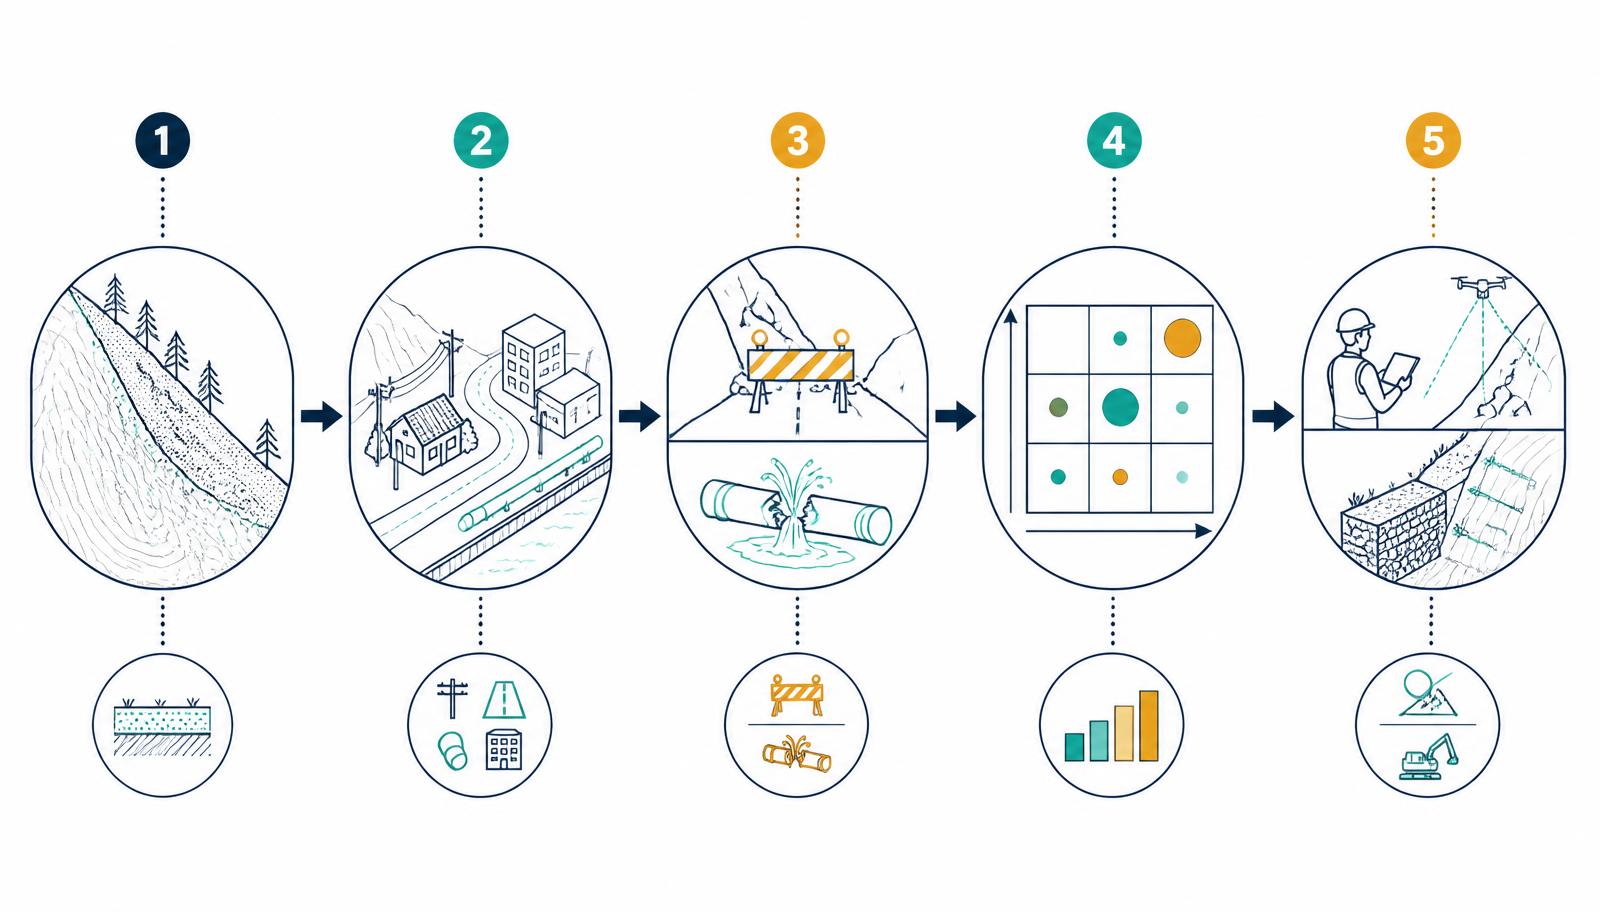
Diagram 2 — The Local-Government Risk Chain
- Hazard — where is terrain susceptible? Geology, slope, rainfall, soils, historical incidents.
- Exposure — what people, assets and infrastructure are present? Roads, utilities, facilities, population, development.
- Consequence — what happens if failure occurs? Route loss, service disruption, isolation, damage, cascading effects.
- Priority — where should government focus first? High consequence plus high susceptibility plus changing conditions.
- Action — inspect, engineer, maintain, mitigate, plan, prepare, with clear ownership and decision triggers.
GIS is moving from describing risk to helping agencies prioritize what to investigate, protect and monitor.
GIS is most powerful at the Exposure step. Overlaying susceptibility with what the agency actually manages—roads, bridges, water and sewer lines, utilities, facilities, parcels, structures, evacuation corridors—converts geological analysis into an operational tool. The review of 2,000+ articles confirms this integration as the defining trend of the decade.[1]
Section 04
What Each Department Asks
Landslide risk is cross-departmental by nature. Each function approaches the same physical hazard with a different operational question. GIS is the common spatial layer connecting all of them.
Public Works
- Which unstable slopes threaten roads and infrastructure?
- Which routes lack practical alternatives?
- Where are drainage problems increasing slope vulnerability?
- Which culverts or retaining structures need attention?
- Which sites should be inspected before major storm events?
Engineering
- Which locations warrant geotechnical investigation?
- Where has movement been detected or suspected?
- Which mitigation projects protect the greatest infrastructure value?
- Where should monitoring equipment be installed?
Planning
- Which proposed developments intersect vulnerable terrain?
- Where should additional geotechnical review be required?
- Should hillside-development standards be updated?
- How should susceptibility influence long-range planning?
Emergency Management
- Which neighborhoods could become isolated?
- Are evacuation routes exposed to slope failure?
- Which critical facilities are vulnerable?
- Where could landslides trigger cascading hazards?
GIS / IT
- What datasets are authoritative and current?
- How do we connect hazard layers to asset inventories?
- What update schedules are realistic for remote-sensing inputs?
- How do we document models and maintain auditability?
City / County Leadership
- What is our liability exposure from unaddressed slope risk?
- How do we prioritize mitigation against other capital needs?
- Do our departments share the same risk picture?
- What happens after the map identifies the problem?
Section 05
The Geospatial-AI Maturity Model: You Do Not Need to Start With AI
Sophisticated technology is not the starting point. A jurisdiction with incomplete inventories, fragmented asset information and inconsistent terrain data gains more from improving its GIS foundation than from deploying an advanced predictive model. The path forward is incremental.
An organization cannot become meaningfully predictive until it first becomes connected.
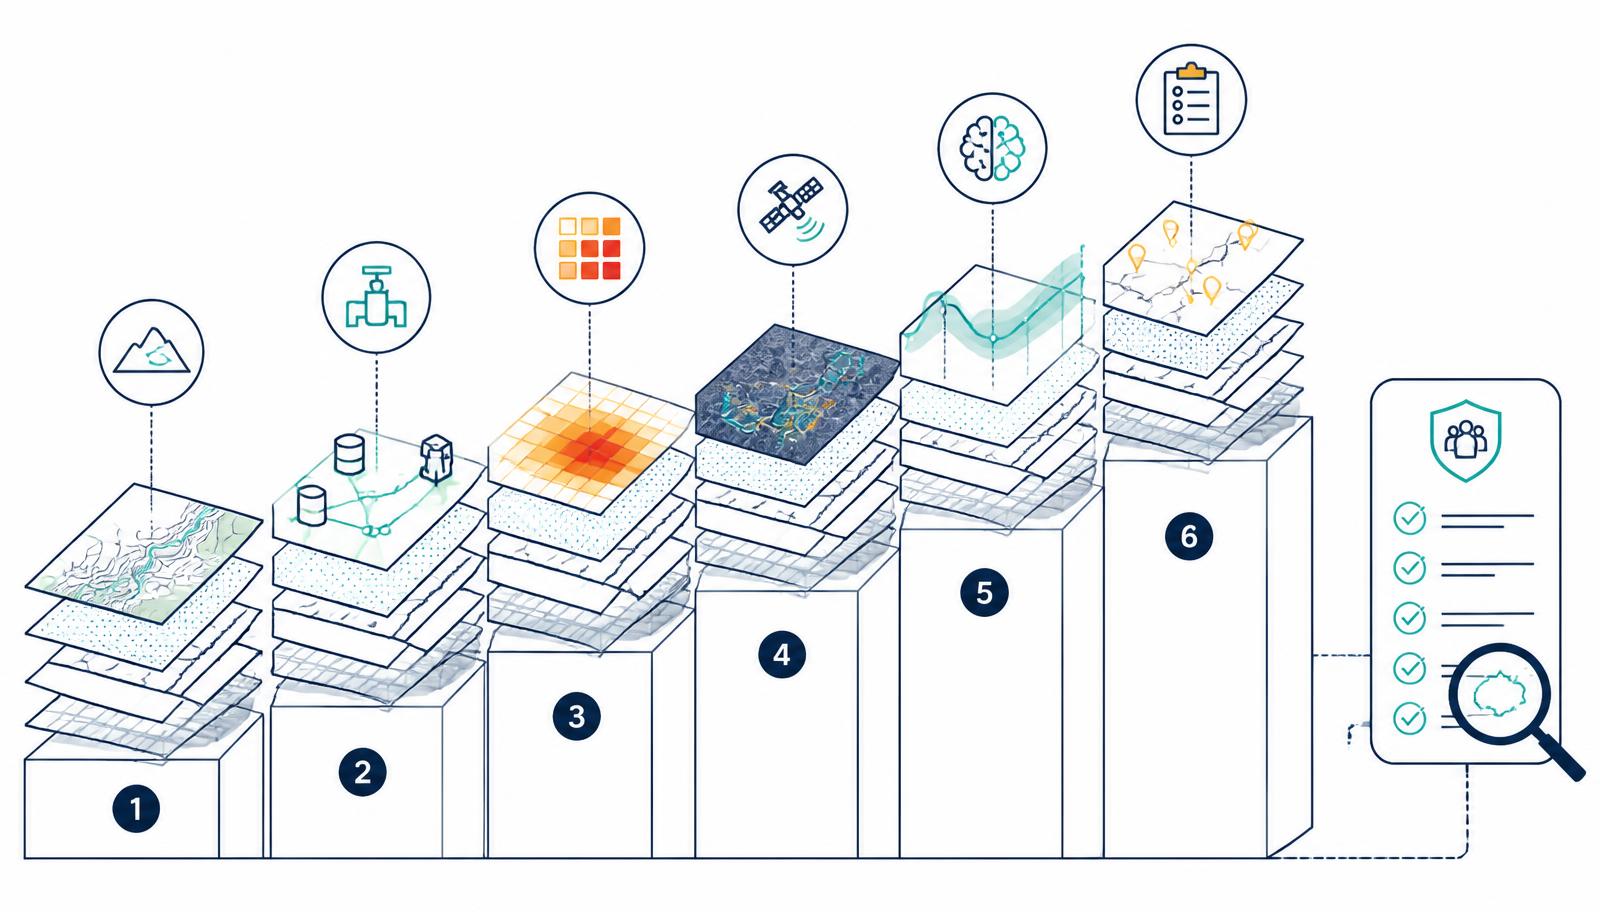
Map — know where susceptibility exists
Elevation, slope, geology, soils, historical landslides and basic susceptibility mapping. The starting point for every organization—and still missing or outdated in many jurisdictions.
Where are our potentially unstable areas?
Connect — relate the hazard to what government manages
Add roads, bridges, water and sewer infrastructure, utilities, parcels, buildings, critical facilities and population. Even this foundational overlay reveals priorities that were not previously obvious.
What could be affected?
Prioritize — move from hazard to consequence
Layer in infrastructure criticality, emergency route designation, service-disruption consequences, maintenance history, replacement cost and development pressure. Research confirms this step changes which locations agencies act on first. [4], [13]
Where should we focus first?
Observe — add change through time
Repeat imagery, LiDAR comparison, UAV surveys, InSAR deformation analysis, rainfall monitoring and land-cover change detection. Sentinel-1 InSAR has been used to identify and classify active slow-moving landslides across regional extents. [11] Multi-sensor studies have tracked the transition from slow creep to rapid failure. [12]
What appears to be changing?
Predict — introduce analytics and AI
Machine learning, automated change detection, spatio-temporal analysis and predictive risk scoring. Hyperparameter-optimized random forest models perform strongly from remote sensing and topographic inputs. [7] Ensemble and deep learning methods extend prediction to national scale. [9], [10] The operational question is whether models can be validated locally and explained to the staff who must act on them.
Where could risk be increasing?
Operationalize — connect risk intelligence to workflows
Inspection scheduling, work orders, engineering investigations, planning review, capital prioritization, preparedness plans, alerts and coordinated response. Geospatial intelligence improves inspection efficiency—helping agencies determine where to look rather than inspecting every slope equally. [8]
What should we do?
The objective is not to reach Level 6 as quickly as possible. It is to move to the level that produces better decisions for your organization.
Section 06
AI, Trust and Governance: Predictive Does Not Automatically Mean Trustworthy
A model that influences infrastructure spending, inspection priorities, development review, emergency planning and public communication must meet a higher bar than predictive accuracy alone.
Treat AI-generated susceptibility as decision support rather than certainty. Responsibility remains with the professional and the organization.
01
What data trained the model?
A model developed in one geographic or climatic environment may not transfer. Comparisons of SVM, logistic regression and neural networks show sampling strategy—not just algorithm choice—produces materially different classifications. [6]
02
Has it been validated locally?
Research accuracy is not operational reliability. Strong performance in Vietnam or Iran may not hold over your geology, rainfall pattern and land-use history. [2], [9]
03
Can staff understand why?
A planner, engineer or emergency manager should see the major factors behind a classification. If a model cannot explain a high score, staff cannot apply judgment or explain it to the public.
04
Who owns the decision?
AI can inform professional judgment; it should never blur responsibility. The research community emphasizes explainable AI for exactly this reason. [1]
05
Can the result be audited?
Document the data used, when it was processed, the model version, assumptions, confidence and limitations. Auditability is not optional when results influence public expenditure or safety.
The best system is not the one with the most sophisticated algorithm. It is the one staff trust enough to use.
Section 07
A Practical Action Plan: Five Things to Do Now
The most advanced Geospatial-AI capabilities are still evolving. Local governments do not need to wait for them. These steps reflect what the research record consistently supports as a durable foundation.
Build the foundation
Audit what already exists: landslide inventories, DEMs and LiDAR, geology and soils, hydrology, historical incidents, maintenance records, planning studies and engineering reports. Data cleaning and metadata standardization are the work most often skipped and most often regretted.
Do we have a baseline our staff trust?
Connect hazard to assets
Overlay susceptibility with roads, bridges, utilities, facilities, parcels, structures, evacuation routes, communications infrastructure and planned capital projects. This step does not require machine learning to be useful.
What would a failure actually affect?
Identify high-consequence pilots
Select two or three priority sites: a hillside above a transportation corridor, a slope above a critical water main, a wildfire-affected drainage, a rapidly developing hillside, a location with documented previous movement. Inspection efficiency improves when agencies know where to look first. [8], [12]
Where do we test, rather than boil the ocean?
Create a shared risk view
Build a common operating picture of susceptibility, infrastructure, inspections, field observations, incidents, mitigation projects and changing conditions—accessible across public works, engineering, planning, emergency management and GIS.
Do departments see the same picture?
Add predictive analytics where they improve a decision
Can historical failures improve classification? Can satellite observations identify meaningful change? Can rainfall and terrain data prioritize inspections? Can the model explain its recommendation clearly enough for government use? The question is never simply whether AI can be used.
Can AI materially improve this specific decision?
Section 08
Questions for Local-Government Leaders
Before making the next technology investment in this space, ask:
- Do we know our highest-consequence slopes—not just our most susceptible terrain?
- Can we connect susceptibility with roads, utilities and critical facilities in a single view?
- Do planning, public works, engineering and emergency management share the same risk picture?
- Do we know which datasets are authoritative, current and trusted by field staff?
- Where would updated remote sensing actually change a decision we would make?
- Do we have enough historical incident data to evaluate a predictive model?
- Can any AI-generated recommendation be explained to an engineer, planner or council member?
- Who acts—and within what timeframe—when elevated risk is identified?
- Could better intelligence reduce unnecessary field inspection and free staff capacity?
- What happens after the map identifies the problem?
If there is no clear answer to the last question, another map or another model is probably not the immediate priority. A better workflow is.
Conclusion: From Mapping Risk to Managing Risk
Landslide susceptibility analysis is evolving from static GIS mapping toward a connected environment incorporating GIS, Earth observation, remote sensing, cloud computing, large geospatial datasets and artificial intelligence.[1] But for local government, the most important transformation is not the technology. It is what the technology allows the organization to do.
Traditional mapping tells government
Here is the hazard.
A connected geospatial environment can say
Here is the hazard. Here is what it could affect. Here is what appears to be changing. Here is where the consequences could be greatest. Here is where we should look first.
GIS becomes less about producing the final map and more about connecting the information required to make a decision. The future of landslide management will be defined by how effectively local governments turn spatial intelligence into better inspections, infrastructure investments, land-use decisions, mitigation and preparedness.
The map is not the decision. The map makes the decision possible.
References
Annotated Bibliography
These 13 sources form the primary research basis for this white paper. Each entry includes a full citation and an annotation explaining its relevance to local-government GIS practice.
[1] Primary Review
Sri, M., Daud, Y., & Muhammad, K. (2026). Mapping global trends in landslide susceptibility research using geospatial technologies. Environmental Earth Sciences, 85, 367.
The foundational source for all statistical claims and trend descriptions here. A bibliometric analysis of 2,002 Scopus-indexed English-language journal articles (2015–2025) using VOSviewer network analysis. It identified five thematic clusters—remote sensing and geospatial automation; machine learning modeling; geotechnics and slope dynamics; multi-hazard and climate adaptation; GIS-based empirical approaches—and documented the post-2019 acceleration in publication volume, with China, India, Italy and the United States dominant. Its core contribution, describing the shift from conventional GIS mapping toward integrated Geospatial-AI infrastructure, is the conceptual frame this paper applies to local government practice.
[2] Machine Learning Benchmark
Bui, D.T., Tuan, T.A., Klempe, H., Pradhan, B., & Revhaug, I. (2016). Spatial prediction models for shallow landslide hazards: a comparative assessment of support vector machines, artificial neural networks, kernel logistic regression, and logistic model tree. Landslides, 13, 361–378.
The most-cited article in the dataset (1,123 citations). Established the benchmark for applying support vector machines, random forests and logistic regression to shallow landslide prediction in Vietnam, showing that ensemble and ML approaches outperformed traditional statistical susceptibility models. Referenced here as evidence that the move from mapping to prediction rests on a decade of empirical validation—and, in the governance section, that models must still be validated against local conditions.
[3] Neural Network + GIS Integration
Pham, B.T., Bui, D.T., Prakash, I., & Dholakia, M.B. (2017). Hybrid integration of multilayer perceptron neural networks and machine learning ensembles for landslide susceptibility assessment at Himalayan area (India) using GIS. Catena, 149, 52–63.
Second-most-cited article (549 citations). Integrated multilayer perceptron neural networks with GIS at Himalayan scale, establishing that neural approaches inside GIS workflows achieve strong accuracy across large, complex terrain. Supports the argument that AI and GIS are complementary rather than competing frameworks.
[4] Multi-Hazard + Urban Consequence
Bathrellos, G.D., Skilodimou, H.D., Chousianitis, K., Youssef, A.M., & Pradhan, B. (2017). Suitability estimation for urban development using landslide susceptibility mapping and multi-hazard assessment map. Science of the Total Environment, 575, 119–134.
Fifth-most-cited article (428 citations). Combined landslide susceptibility with flood risk and urban development pressure for planning decisions in Greece. The clearest peer-reviewed demonstration that consequence-based mapping produces different—and more actionable—priority rankings than terrain-based susceptibility alone.
[5] GIS Machine Learning — Ensemble
Chen, W., Peng, J., Hong, H., Shahabi, H., Pradhan, B., Liu, J., Zhu, A.X., Pei, X., & Duan, Z. (2018). Landslide susceptibility modelling using GIS-based machine learning techniques for Chongren County, Jiangxi Province, China. Science of the Total Environment, 626, 1121–1135.
Sixth-most-cited article (393 citations). Confirmed that ensemble methods combining multiple algorithms consistently outperform any single model. Useful context when evaluating vendor or research-partner models: require multi-model approaches and documented performance metrics tied to local validation.
[6] Training Data & Model Governance
Kalantar, B., Pradhan, B., Naghibi, S.A., Motevalli, A., & Mansor, S. (2018). Assessment of the effects of training data selection on landslide susceptibility mapping: a comparison between SVM, LR and ANN. Geomatics, Natural Hazards and Risk, 9(1), 49–69.
Third-most-cited article (454 citations). Showed that how training samples are selected—not just which algorithm is used—materially changes the resulting susceptibility classification. The strongest support for the governance questions on training data and local validation; any AI-based susceptibility product should document sources, sampling methodology and local validation results before operational deployment.
[7] Random Forest + Hyperparameter Optimization
Sun, D., Wen, H., Wang, D., & Xu, J. (2020). A random forest model of landslide susceptibility mapping based on hyperparameter optimization using Bayes algorithm. Geomorphology, 362, 107201.
Seventh-most-cited article (381 citations). Bayesian-tuned random forest models substantially outperform default settings using remote sensing and topographic inputs—evidence that the predictive step has matured beyond experimentation. Relevant to agencies weighing off-the-shelf against locally calibrated tools.
[8] Prediction, Monitoring & Early Warning
Chae, B.G., Park, H.J., Catani, F., Simoni, A., & Berti, M. (2017). Landslide prediction, monitoring and early warning: a concise review of state-of-the-art. Geosciences Journal, 21(6), 1033–1070.
Ninth-most-cited article (320 citations). Synthesizes instrumentation, remote sensing, geotechnical monitoring and alert-threshold methods. The operational takeaway: pairing susceptibility analysis with targeted monitoring at priority sites improves inspection efficiency—agencies that know where to look allocate limited field capacity far better than those inspecting uniformly.
[9] Deep Learning at National Scale
Ngo, P.T.T., Panahi, M., Khosravi, K., Ghorbanzadeh, O., Kariminejad, N., Cerda, A., & Lee, S. (2021). Evaluation of deep learning algorithms for national scale landslide susceptibility mapping of Iran. Geoscience Frontiers, 12(2), 505–519.
Eighth-most-cited article (333 citations). Deep learning applied to a full national landslide inventory with strong accuracy—susceptibility modeling is no longer confined to small study areas. State and federal regional products may increasingly use these methods, so local GIS teams need to know how to validate and apply them.
[10] Deep Learning + Satellite Topographic Data
Azarafza, M., Azarafza, M., Akgun, H., Atkinson, P.M., & Derakhshani, R. (2021). Deep learning-based landslide susceptibility mapping using satellite data and topographic analysis. Scientific Reports, 11, 24112.
Tenth-most-cited article (312 citations). Open-access demonstration that satellite-plus-AI susceptibility mapping is validated, published methodology rather than experiment—directly usable by agency staff preparing internal briefings or procurement specifications.
[11] InSAR Surface Deformation — Regional
Meng, Q., Confuorto, P., Peng, Y., Raspini, F., Bianchini, S., Han, S., et al. (2020). Regional recognition and classification of active loess landslides using two-dimensional deformation derived from Sentinel-1 interferometric radar data. Remote Sensing, 12(10), 1541.
Shows that freely available Sentinel-1 InSAR data can detect, map and classify active slow-moving landslides across regional extents—movement invisible to conventional inspection or optical imagery. InSAR monitoring is accessible: agencies can partner with universities or state programs for processed products as part of an Observe-level program.
[12] Multi-Sensor — Slow to Rapid Failure
Handwerger, A.L., Lacroix, P., Bell, A., Booth, A.M., Huang, M., Mudd, S.M., et al. (2025). Multi-sensor remote sensing captures geometry and slow-to-fast sliding transition of the 2017 Mud Creek landslide. Scientific Reports, 15(1).
Combining satellite imagery, InSAR and ground sensors tracked the transition from slow creep to rapid failure at a California site—precisely where early warning has the greatest potential to protect life and infrastructure. Supports prioritizing sites with documented prior movement for multi-sensor monitoring.
[13] Building-Level Vulnerability
Li, G., Liu, D., Ruan, M., Zhang, Y., He, J., Guo, Z., et al. (2025). Quantitative vulnerability assessment of buildings exposed to landslides under extreme rainfall scenarios. Buildings, 15(11), 1838.
Extends analysis from terrain susceptibility to quantitative damage estimation at the individual building level, showing that susceptibility alone understates consequence in dense or high-value built environments. Directly applicable to capital prioritization, development review and conversations with owners, insurers and elected officials.